Statistics NZ

Service design research
The challenge
The previous NZ census had a historically low response rate, leading to poor representation from many demographics in Aotearoa. The Data Sourcing Project undertook the challenge to research how users interact with Stats NZ and effectively identify opportunities to design a better service to collect data from New Zealanders.
My contributions
As a senior designer, I lead the major workstream of the survey respondent experience research. This focused on gathering qualitative data around the entire experience of a survey response with Stats NZ.

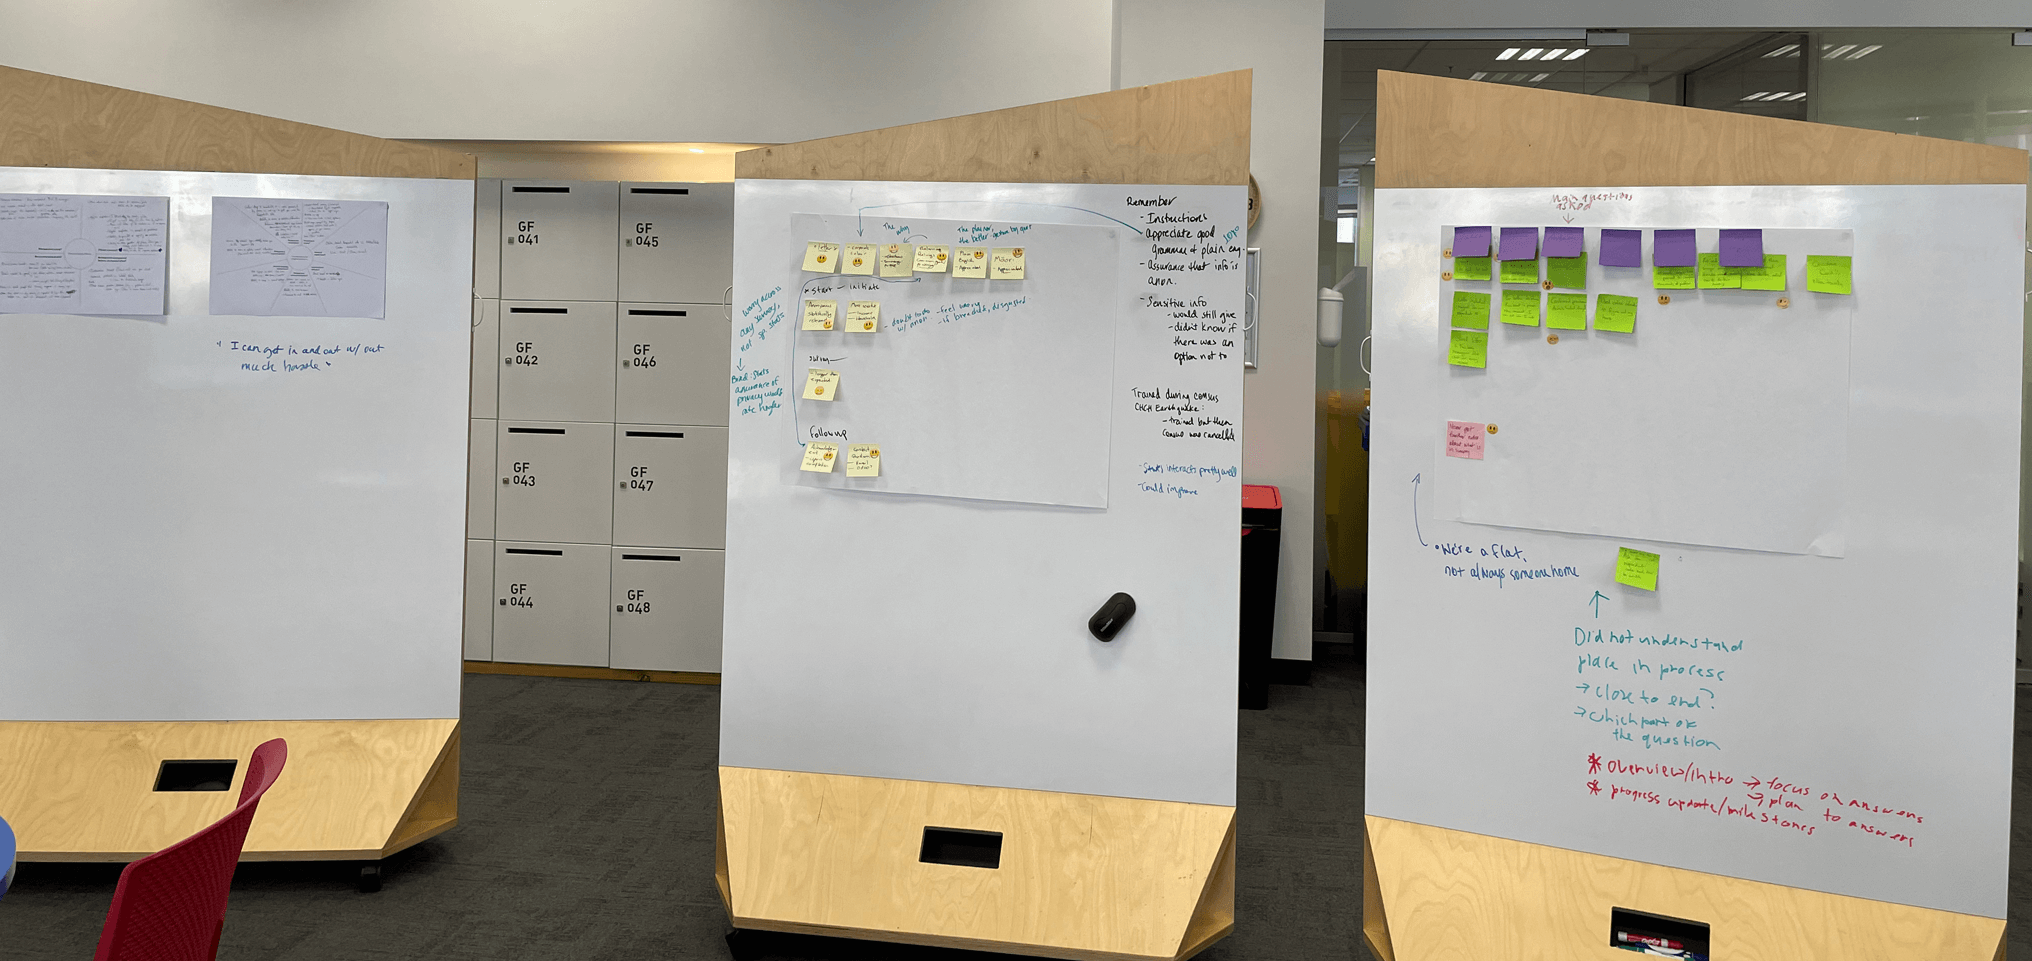
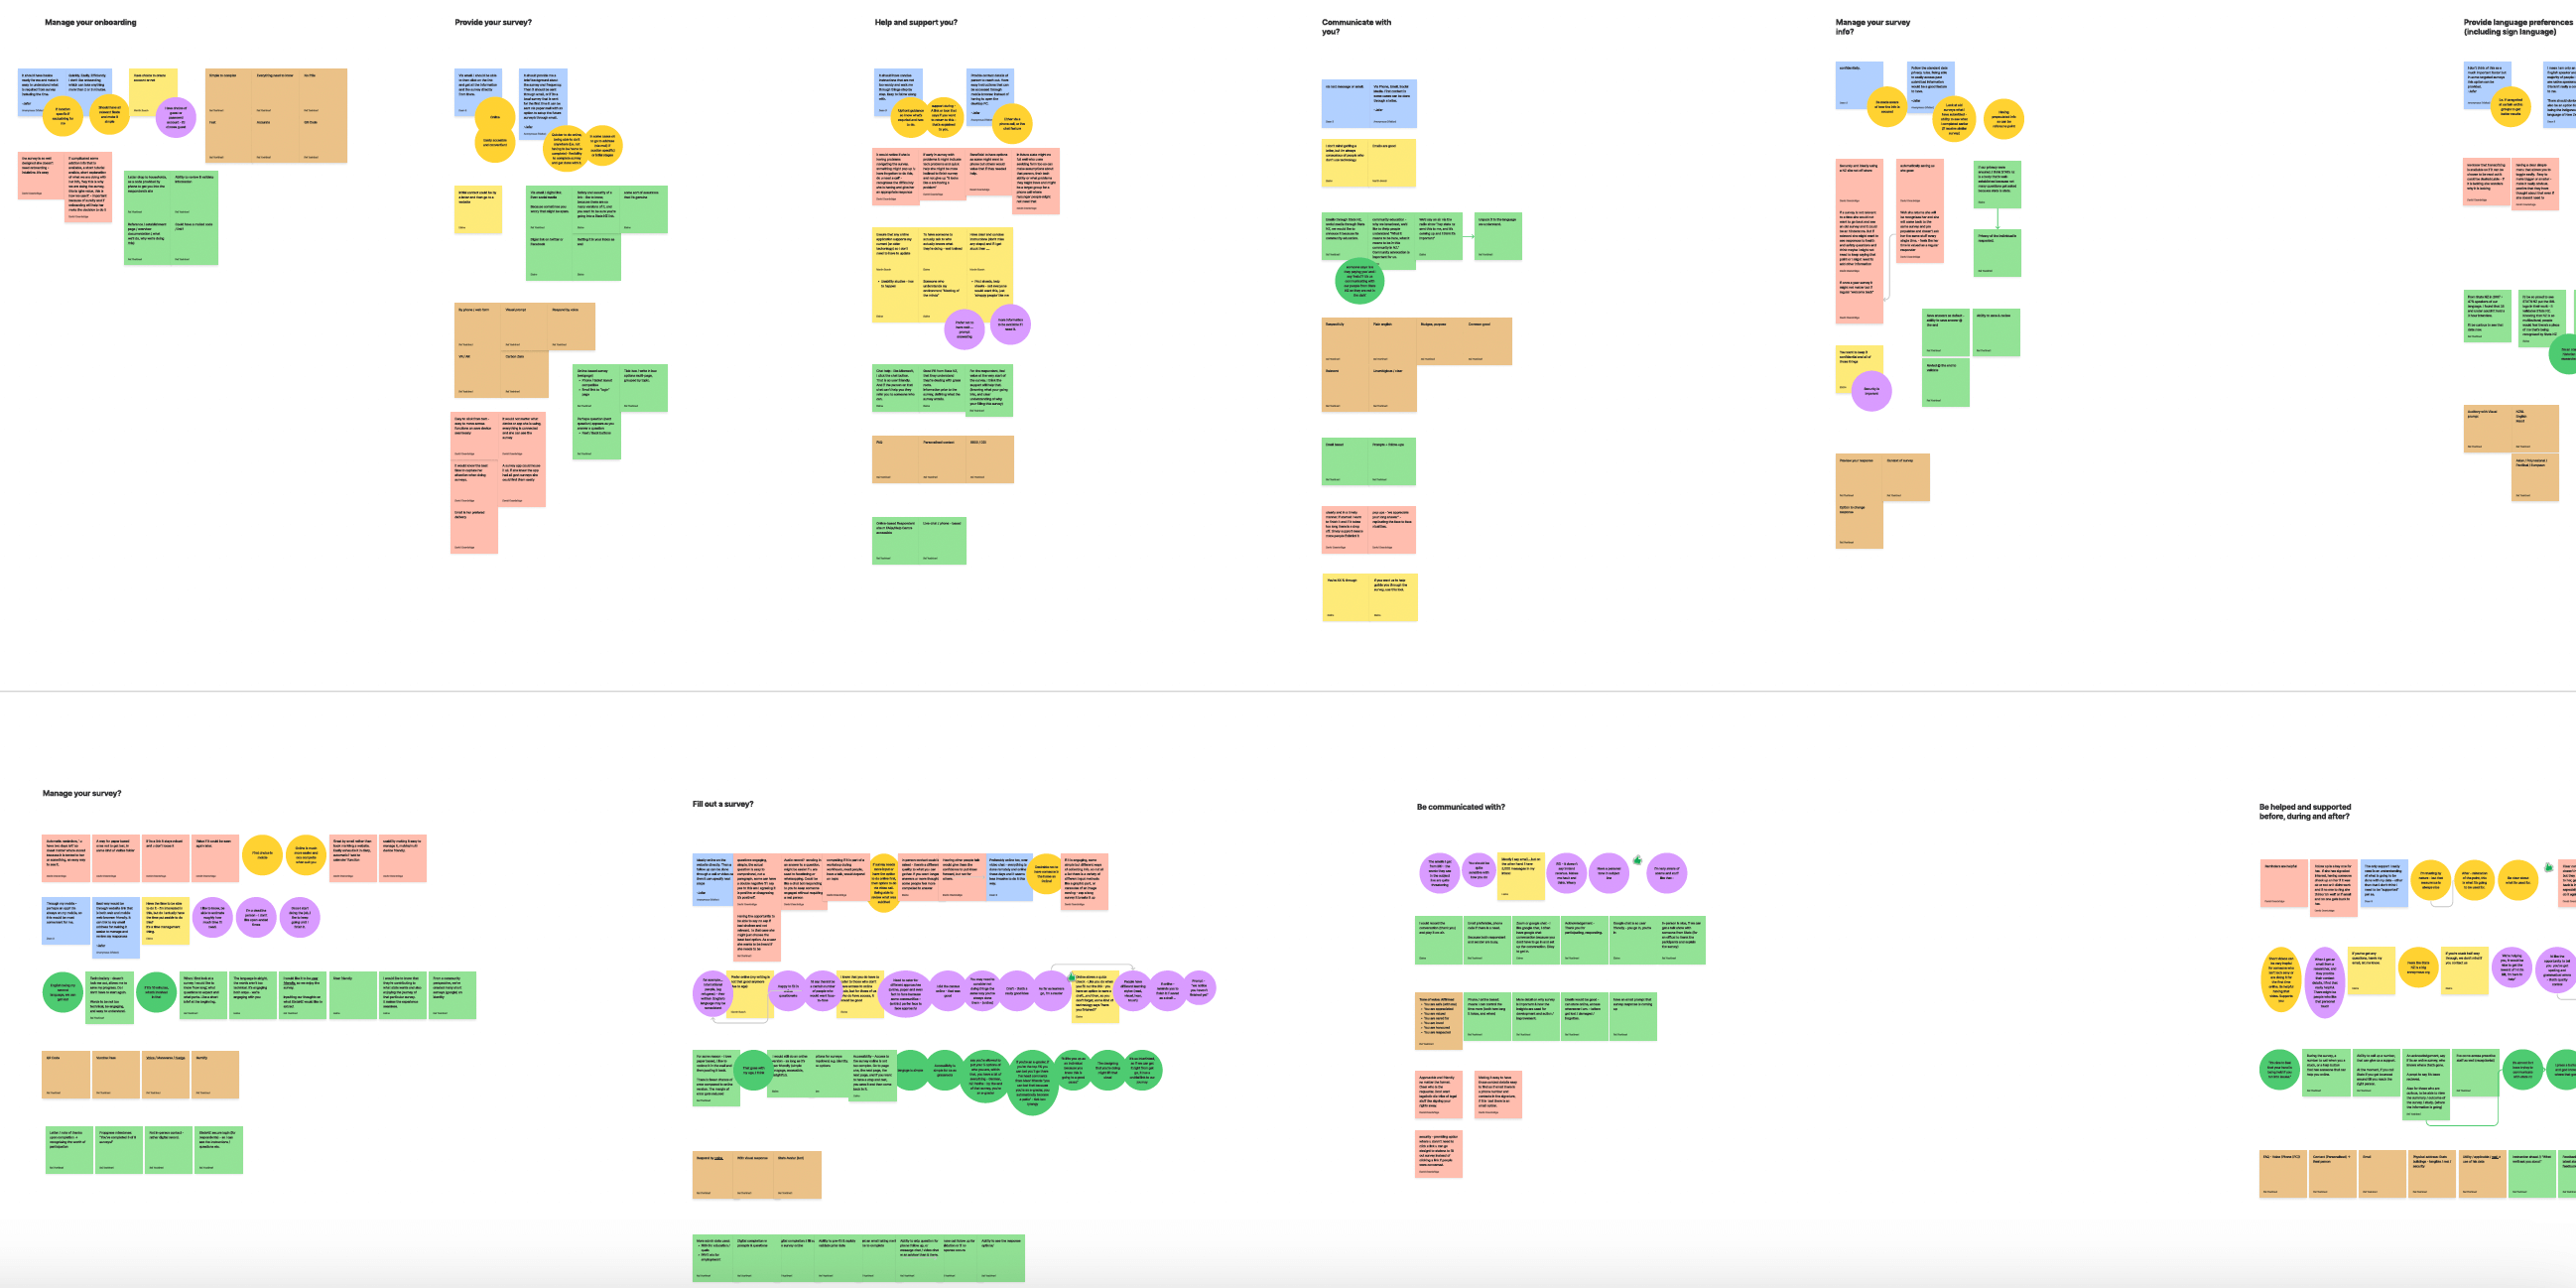
For this, I designed the research plan with a UX-lead approach, identifying the research methodology and outputs to orate the research data. I then recruited for and planned workshops to speak to respondents in the public, as well as business respondents. As part of designing these workshops, I organised a team of UX designers and Business Analysts to assist with these workshops. This allowed us to make the most out of our time with the user and lead to a good sampling of qualitative data.

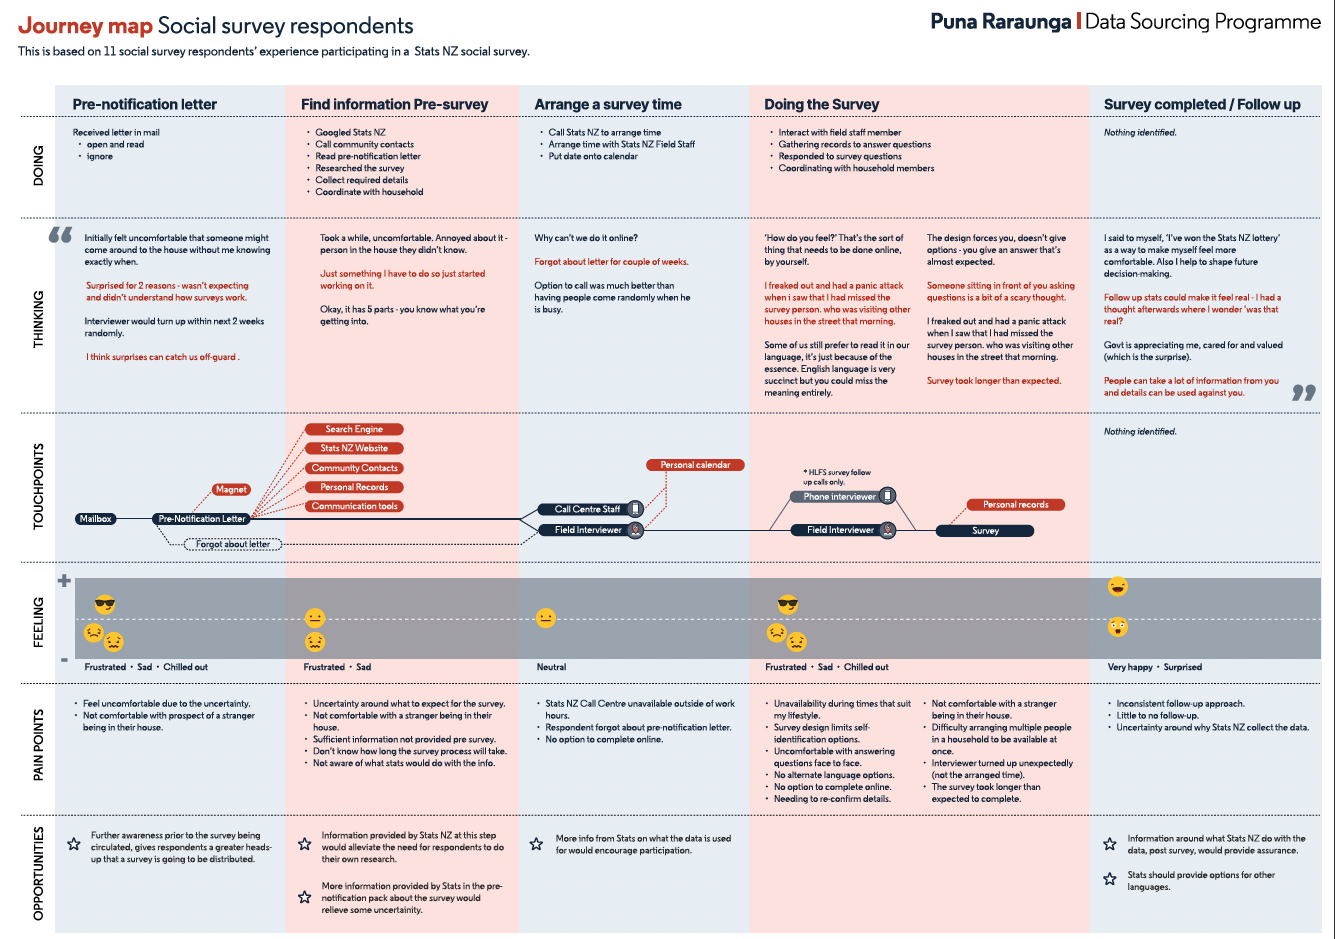
I followed with team insight-gathering, which lead to journey maps, and fed into blueprints, as well as other collateral. As a senior, I gave guidance and produced templates for the junior UX designers along the way.
Social survey journey PDF
Designing a custom approach
This large-scale research involved building relationships with senior government employees, both within Stats NZ and within other agencies. This was all to serve the purpose of understanding how best to gain insights into our users.

Once I had an idea of what user research might work, I designed the approach and our team began the recruitment campaign, working with marketing and other areas of Stats NZ. Specifically, I worked with representatives who had connections with the accessibility community and Māori and Pasifika communities. I also worked closely with experts to create a Kaupapa Māori research approach.

Uncomfortable respondents
We synthesised the data, looking for patterns across our respondents. From there, we pulled out what which user did, thought and felt as they explained the various touch-points in their journey. We used that and any opportunities that came up to populate a journey map for the respondents. This fed into the service blueprint (already in progress by another team).

We found strong themes around
Uncomfortable - Confrontation of a stranger in the house.
Unprepared - Uncertainty of what will be asked, not enough information provided pre-survey. Forgot about survey.
Privacy - Curious about what Stats would do with sensitive information.
Inconvenient - Finding a time that fits some people’s lifestyle was an issue. Difficult arranging with a full household.
Unplanned - Interviewers turned up unexpectedly.
No follow-up - inconsistent or no follow-up. Unsure of what would happen to respondent’s sensitive information.